# from esploco import esploco
# from espresso import espresso
# import warnings
# warnings.simplefilter('ignore')How to use
- Download a demo dataset from here
- Import libraries
Hint: to see the function signature of any function or method, type function?
# esploco.esploco?# esplocoPath='/Users/sangyuxu/esploco demo'
# e = espresso(esplocoPath, expt_duration_minutes=120)
# ele = esploco.esploco(esplocoPath, 0, 120, companionEspObj = e)Calculate peri-feed speeds
# ele.calculatePeriFeedSpeed(e, monitorWindow=120)
# ele.resultsDf.columns
Index(['ChamberID', 'countLogID', 'AviFile', 'ExperimentState', 'Tube1',
'startMonitorIdx', 'startFeedIdx', 'startFeedIdxRevised', 'endFeedIdx',
'endFeedIdxRevised', 'endMonitorIdx', 'Latency_min', 'Starved hrs',
'MealSizePerFly_µL', 'AverageFeedSpeedPerFly_µl/s',
'MeanSpeed120sBeforeFeed_mm/s', 'MeanSpeedDuringFeed_mm/s',
'MeanSpeed120sAfterFeed_mm/s', 'MeanMealDurationPerFly_s',
'AverageFeedVolumePerFly_µl', 'AverageFeedCountPerFly',
'AverageFeedDurationPerFly_min', 'FeedVol_pl', 'duringBeforeSpeedRatio',
'afterBeforeSpeedRatio', 'ID', 'Status', 'Genotype', 'Sex',
'MinimumAge', 'MaximumAge', 'Food1', 'Food2', 'Temperature', '#Flies',
'Starvedhrs', 'Date', 'averageSpeed_mm/s', 'xPosition_mm',
'yPosition_mm', 'inLeftPort', 'inRightPort', 'countLogDate',
'feedLogDate', 'falls'],
dtype='object')Calculate falls
# ele.calculateFallEvents()Detecting Fall Events...
[------]
DoneStacked plot for feeds and other metrics
# Fstacked, feeds_sorted, colorBy = ele.plotStacked(endMin = 120,
#                           colorBy = ['Status', 'Temperature'],
#                           metricsToStack = ['Volume', 'Speed'],
#                           figsize = None,
#                           plotNonFeeders=False,
#                           showRasterYticks=False,
#                          ylimPresets = None)

# # consult the function signature for different configurations of input arguments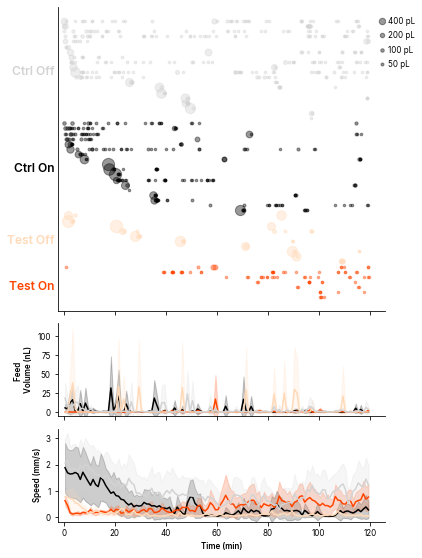
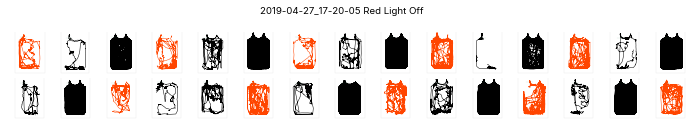
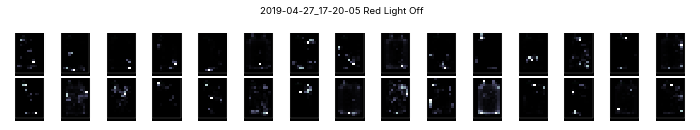
Plotting small multiples
# ele.plotChamberSmallMultiples()Espresso Runs found:
['2019-04-03_12-01-45' '2019-04-27_17-20-05']
plotting 2019-04-03_12-01-45...
plotting 2019-04-27_17-20-05...(array([<Figure size 720x144 with 30 Axes>,
<Figure size 720x144 with 30 Axes>], dtype=object),
array([<Figure size 720x144 with 30 Axes>,
<Figure size 720x144 with 30 Axes>], dtype=object))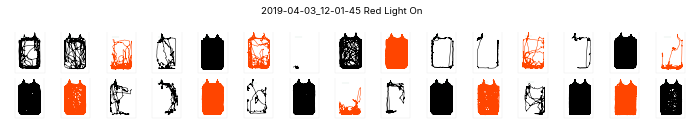
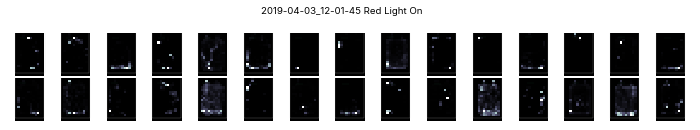
Mean heat maps
Plot mean heatmaps with seconds as unit
# meanheatmaps = ele.plotMeanHeatMaps(row = 'Status', col = 'Temperature')<Figure size 360x748.8 with 0 Axes>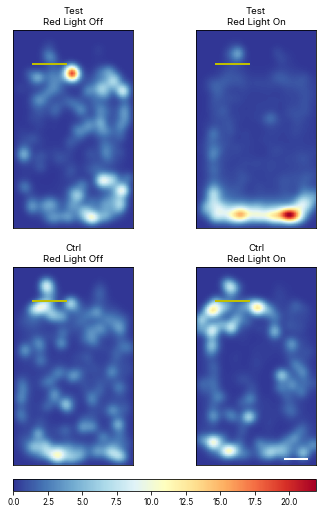
Plot mean heatmaps with z-score
# meanheatmaps = ele.plotMeanHeatMaps(row = 'Status', col = 'Temperature', plotZScore = True)<Figure size 360x748.8 with 0 Axes>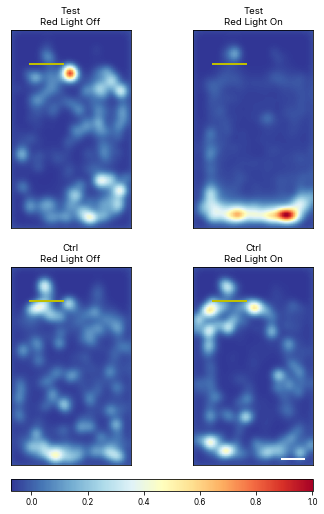
Plot mean heatmaps with arbitrary vmin and vmax
# meanheatmaps = ele.plotMeanHeatMaps(row = 'Status', col = 'Temperature', plotZScore = True, vmin = 0.2, vmax = 0.6)<Figure size 360x748.8 with 0 Axes>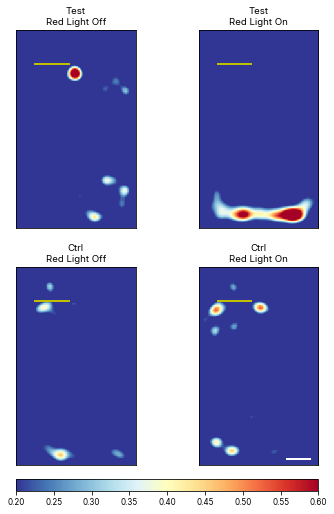
Ribbon Plots
# ribbonplot = ele.plotBoundedLines(locoSuffix = 'V', col = 'Temperature', colorBy = 'Status')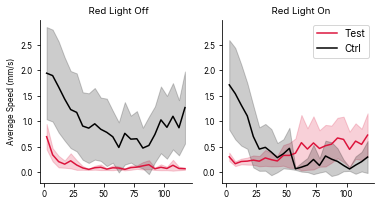
Contrast plots
Contrast plots can be made for any of the metrics in .resultsDf:
- ‘MeanSpeed120sBeforeFeed_mm/s’,
- ‘MeanSpeedDuringFeed_mm/s’,
- ‘MeanSpeed120sAfterFeed_mm/s’,
- ‘MeanMealDurationPerFly_s’,
- ‘AverageFeedVolumePerFly_µl’,
- ‘AverageFeedCountPerFly’,
- ‘AverageFeedDuration_min’,
- ‘MealSizePerFly_µL’,
- ‘AverageFeedSpeedPerFly_µl/s’,
- ‘FeedVol_pl’,
- ‘Latency_min’,
- ‘duringBeforeSpeedRatio’,
- ‘afterBeforeSpeedRatio’,
- ‘averageSpeed_mm/s’,
- ‘xPosition_mm’,
- ‘yPosition_mm’,
- ‘inLeftPort’,
- ‘inRightPort’,
The following other fields in .resultsDf can be used as independent variables.
- ‘ChamberID’,
- ‘Starved hrs’,
- ‘ID’,
- ‘Status’,
- ‘Genotype’,
- ‘Sex’,
- ‘MinimumAge’,
- ‘MaximumAge’,
- ‘Food1’,
- ‘Food2’,
- ‘Temperature’,
- ‘#Flies’,
- ‘Starvedhrs’,
- ‘Date’,
- ‘countLogDate’,
- ‘feedLogDate’
# import dabest
# print(dabest.__version__)
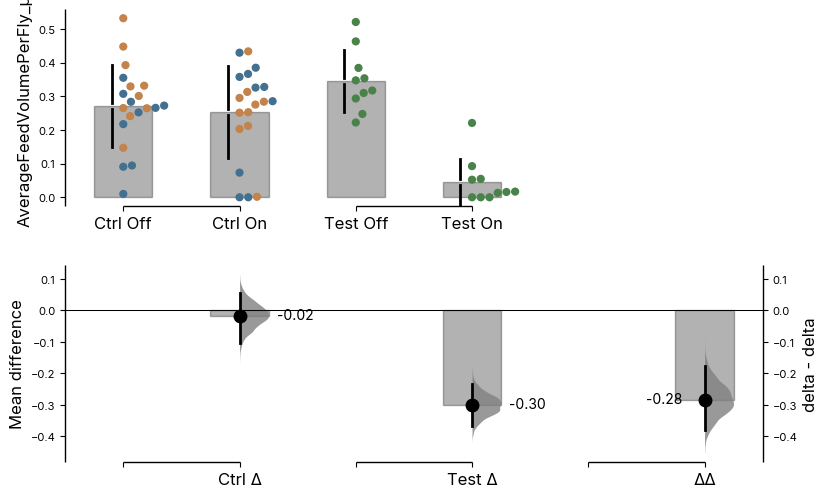
# contrast = dabest.load(data = ele.resultsDf,
# x = ['Temperature', 'Genotype'],
# y = 'AverageFeedVolumePerFly_µl',
# experiment = 'Status', x1_level=['Red Light Off', 'Red Light On'] , delta2 = True)
# f = contrast.mean_diff.plot()
# f.axes[0].set_xticklabels(['Ctrl Off', 'Ctrl On', 'Test Off', 'Test On'])
# f.axes[1].set_xticklabels(['', 'Ctrl Δ', '', 'Test Δ', '', 'ΔΔ'])2024.03.29[Text(0, 0, ''),
Text(1, 0, 'Ctrl Δ'),
Text(2, 0, ''),
Text(3, 0, 'Test Δ'),
Text(4, 0, ''),
Text(5, 0, 'ΔΔ')]